Accelerate Success with AI-Powered Test Automation – Smarter, Faster, Flawless
Start free trialIn the first article in this series I have talked about the three steps that are needed in order to High Jump to High quality. These were:
- Start – The preparatory phase in which test cases and charters are outlined and the necessary domain understood.
- Run – Starting test case execution across one or more execution methods (Automation, AI automation, crowdsource & manual ).
- Jump – Refining Exploratory charters and improving the quality envelope with every regression that is carried out.
In the second article we had the results of a short five question survey that many readers responded to. We then compared what the respondents of the survey said with what we saw when carrying out only test case based or exploratory testing versus doing a combination of both in one regression cycle with three parallel teams. The comparative unreliability of Exploratory testing versus Test Case based testing was a key point. This was counter balanced by the net higher validated defect count by Exploratory.
In this final article of this series we have taken 6 months of execution data across 5 products (our terminology for an area under test) that are in different domains and analyzed the execution results and the defects found.
5 Products Compared Over a 6 Month Period
Here is the data for the yield of defects found for 5 different products from 3 different companies using a combination of Test Case based and Exploratory testing over a 6 month period. The defect data is broken out by product, priority and by monthly data. The three sample companies are each from completely different domains. All defects are ones that were accepted as valid defects by the customer. NOTE the number of test cases is not identical between each product line. We have normalized the results.
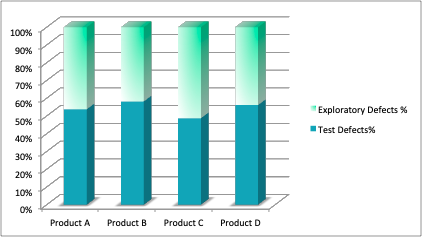
Figure 4 Exploratory vs Test case total defect count
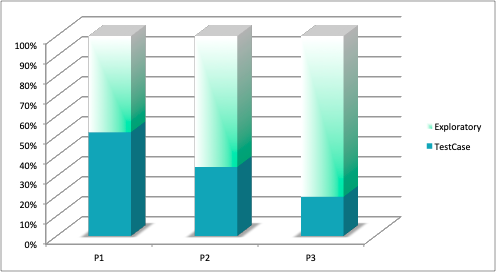
Figure 5 Exploratory vs Test case All products by Priority

Analysis
- Defect yield is very consistent across all domains.
- Defect yield per regression is proportional to the number of test cases being regression tested.
- Test case based testing yield is overall lower in quantity. However when something goes wrong, very high priority test cases break in the Test case based testing area.
- Priority 1 bugs were evenly split between Test Case and Exploratory based testing.
The Equal split between priority 1’s originating from Test case based testing and Exploratory is extremely interesting. When you plot this as a function of time what you see is that sometimes P1 bugs are found by Exploratory testing and sometimes by Test case based testing which highlights the value of using both approaches. It’s a case of you never know where the defects will be.
It’s actually surprising to see (in Figures 6 and 7 below) how consistent the data is in averaging out to approximately an equal contribution from both sides. The diagrams show two different patterns for two products from two different companies. In one initially the P1 contribution was from Test Cases and later on it moved to Exploratory P1 contribution. The second shows an alternating contribution of defects. Yet they both average out to equal contributions!
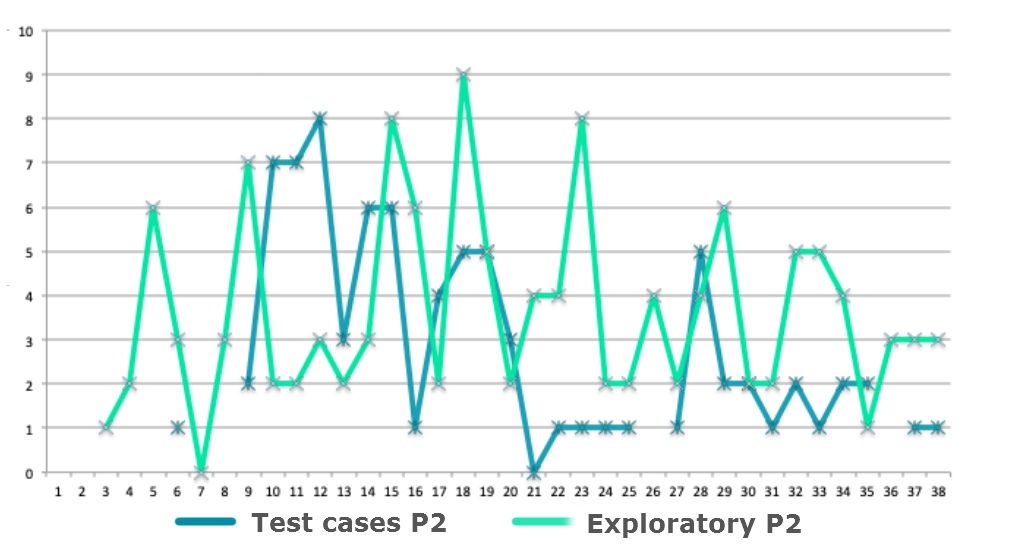
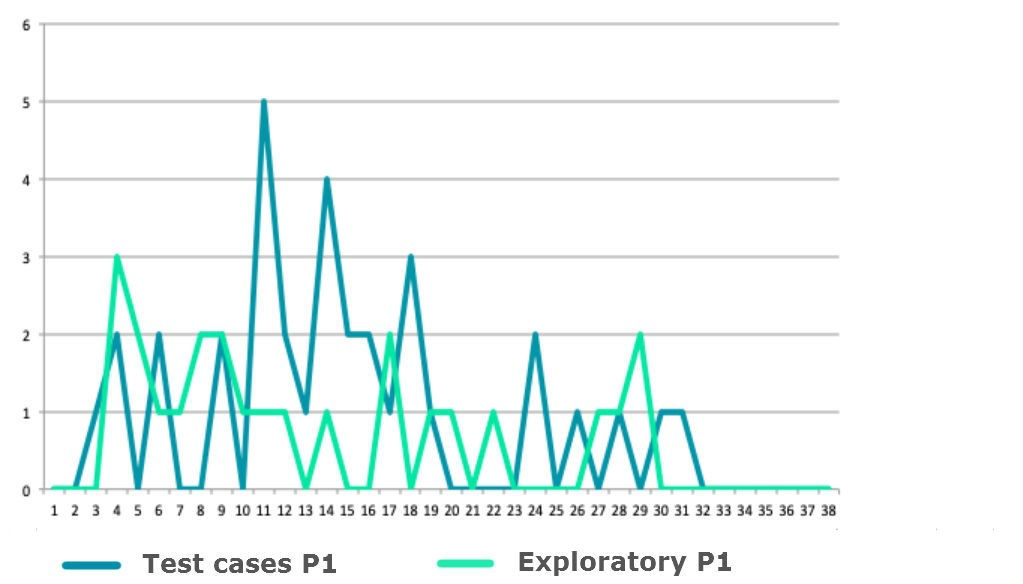
Figure 8 shows the variation in P2 defect finds and again there is no consistency on the source of defects for any individual regression. For P3 defects the contribution is far larger from Exploratory defects and thus there is a consistently higher number of P3 defects from Exploratory. However, P3 defects are the lowest value defects thus the fact that the yield from Exploratory is significantly higher is not of as high value as one might think.
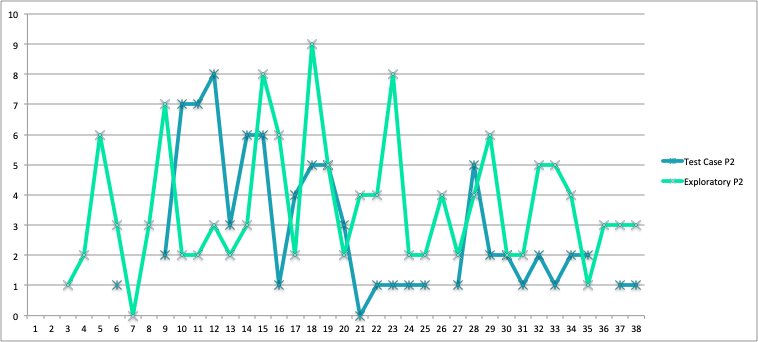
Figure 8 Product A P2 Test vs Exploratory
Conclusion
At Webomates, we have gathered a decent set of data and carried out analysis that shows that the combination of Test Case based testing and Exploratory results in a higher yield in defects as compared to each of the techniques on their own. This is an ongoing area of data collection and analysis at Webomates.
Both Test case based testing and Exploratory testing have their own advantages.
- Exploratory has a higher yield of defects but a lot of them are Priority 3 lower value defects.
- Exploratory is also not a predictable indicator of base quality and may miss critical defects.
- For the higher value Priority 1 defects the net contribution from both techniques is equal and unpredictable further supporting the need to carry out both forms of testing to achieve a higher level of quality.
- Summary: DO BOTH for best results.
If you are interested in how you can rapidly add or expand both Exploratory and Test case based testing to your product please click on the link below and schedule a demo. If you like the research that we are carrying out and want to stay abreast of it please register here and you will be informed when we add to our blog.
Tags: High Quality, Software Testing

Leave a Reply